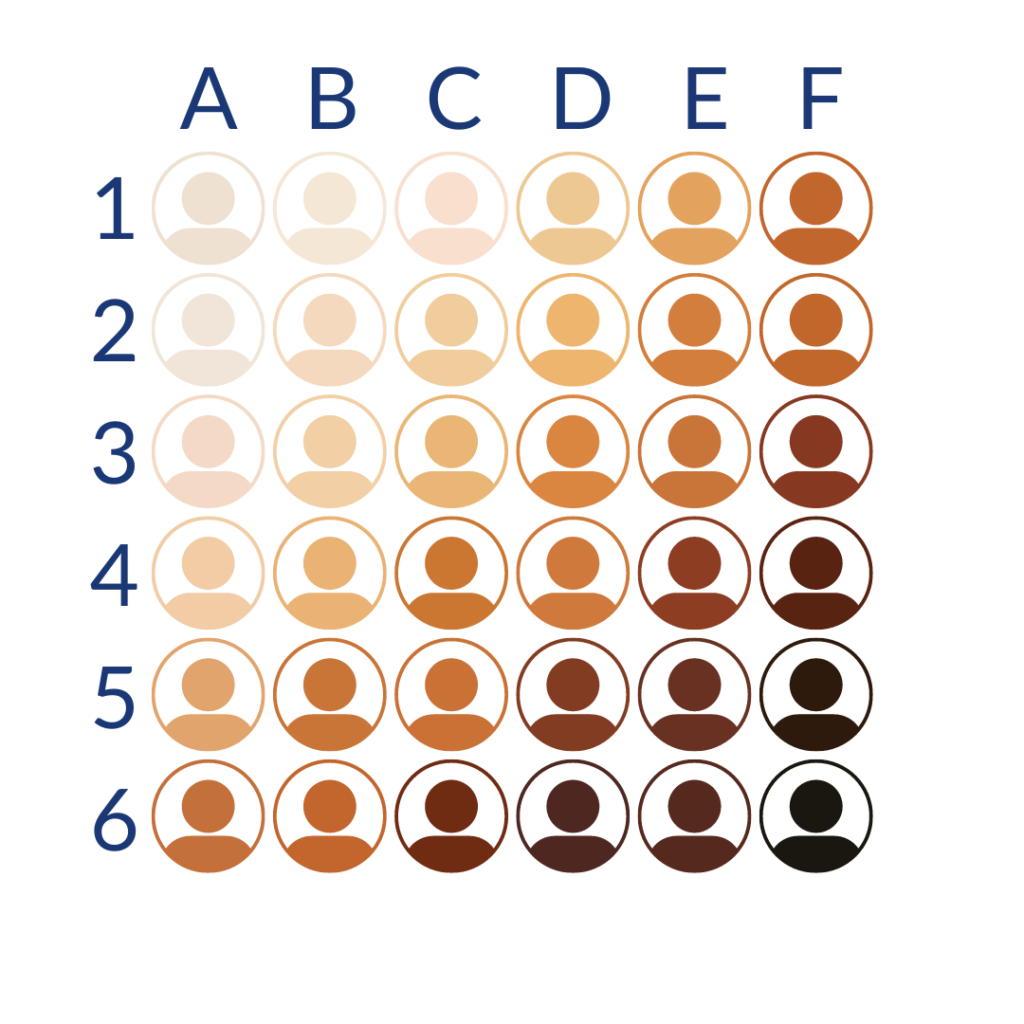
If you were to map the areas that best represent your clients, where would they be on this graphic?
What about your employees?
What about your leadership team?
Notice any trends?
If your answers tended to clump together within 3×3 grids rather than spread across rows or columns, you are ignoring valuable time, treasure, talent, and, let’s be honest, decency.
Your leadership team and workforce are stronger when it reflects those they serve. If all the stakeholders look alike, you have work to do.
