Have you ever been on a boat, sailing carefree, with the sun shining and the distant shore in sight only to have it suddenly obscured by a thick unexpected fog rolling in? Having the right instruments to help guide you out of an emergency can save your life. That’s why I believe it’s crucial to equip yourself with a Personal Dashboard. A simple set of instruments to look at regularly that help ease your nerves and keep you on course.
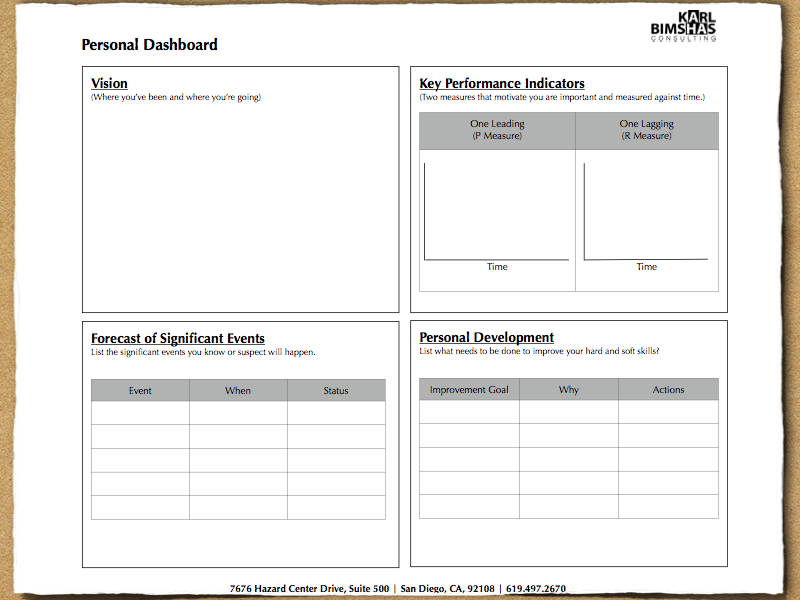
Here’s a straightforward way to build a quick dashboard of your own. Take a sheet of paper and fold it in fours to crease it, then unfold it and label the upper left square “Vision.” Vision is your picture of success. In this square build context by showing where you’ve been and where you want to go in the next few months. If you don’t know where in the world you are or where in the world you’re headed; how in the world do you hope to get there? Make it simple on yourself, draw a picture, make a list; it doesn’t matter, just as long as it’s clear for you.
Label the lower left box, under your vision, “Forecast of Significant Events.” This is where you reasonably predict what’s coming in the near future. In sales, it’s called a pipeline, for meteorologists’, it’s the weather forecast. Consult your calendar or whatever resources you have to list the events which are likely, or definitely going to happen in the next 30-60 days and determine if they could aid or hinder your vision.
In the upper right box write, “Key Performance Indicators”. This is where you identify and track two measures that motivate you and are important. Sometimes people freak-out over metrics. Don’t. Metrics are neutral, so relax and draw two big “Ls” next to each other in this square. Yes, I tricked you into making two graphs. The horizontal line represents time, preferably days, weeks, or months. The vertical line represents units or amounts (e.g. pounds lost, dollars gained, cups of coffee drank, books read.) Think about your vision and what you want to achieve. Think about the thing you can do to cause the result you want. This is called your process measure, or leading indicator. That’s your first graph. The second graph is more common. It’s the easy one, the result measure, or lagging indicator. A leading measure might be the number of lollipops you ate, and the lagging measure is the number of cavities you got.
In the lower right square write, “Personal Development.” It’s probably clear to you that there are some things you need to improve. These can be hard or soft skills. Hard skills are the technical aspects; how to tie a knot, for an example. Soft skills are more personal, and are bigger picture than the task at hand, yet they complement it, for example, learning another language or reading more books.
When you complete this exercise, you will have a dashboard that if consulted and used frequently will help you reach your vision with greater efficiency.

Leave a Reply